Long Term Planning
Fundraising decisions made today can affect income for many years. Donors recruited now may still be giving five years from now. Retention compounds over time. Investments made today may take several years to pay back.
Forward helps you bring those long-term effects together in one five-year fundraising plan. It helps you move from understanding your current trajectory to actively planning the growth you want to achieve.
Build your current outlook
Start with your existing donor base and your plans for acquisition, donor development and investment.
Enter assumptions about donor numbers, gift value, retention and costs. Forward brings these together to show how your fundraising programme could develop over the next five years.
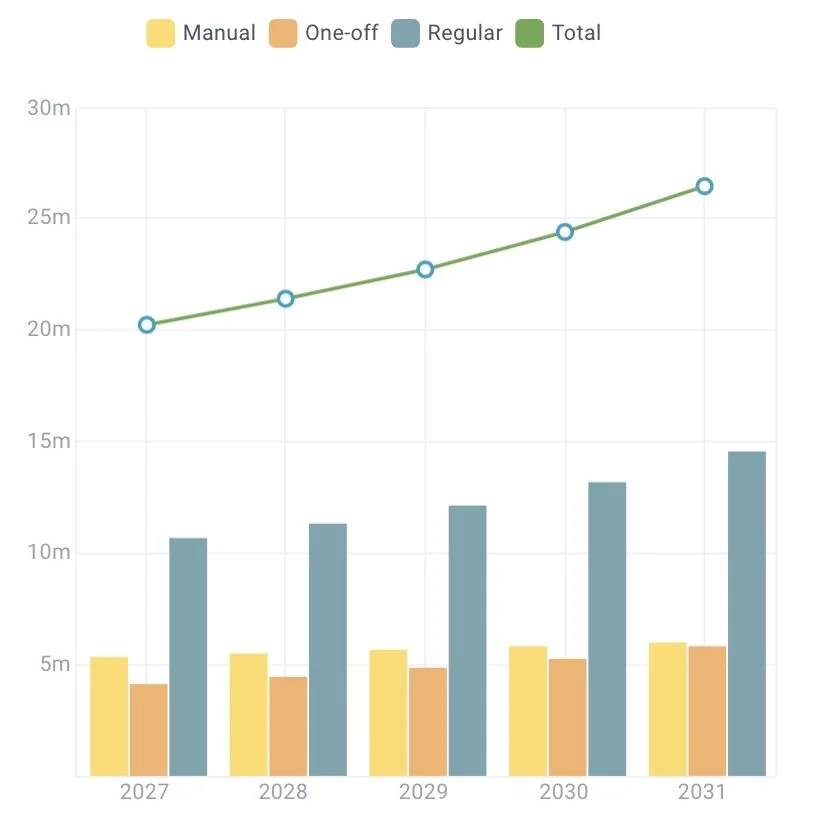
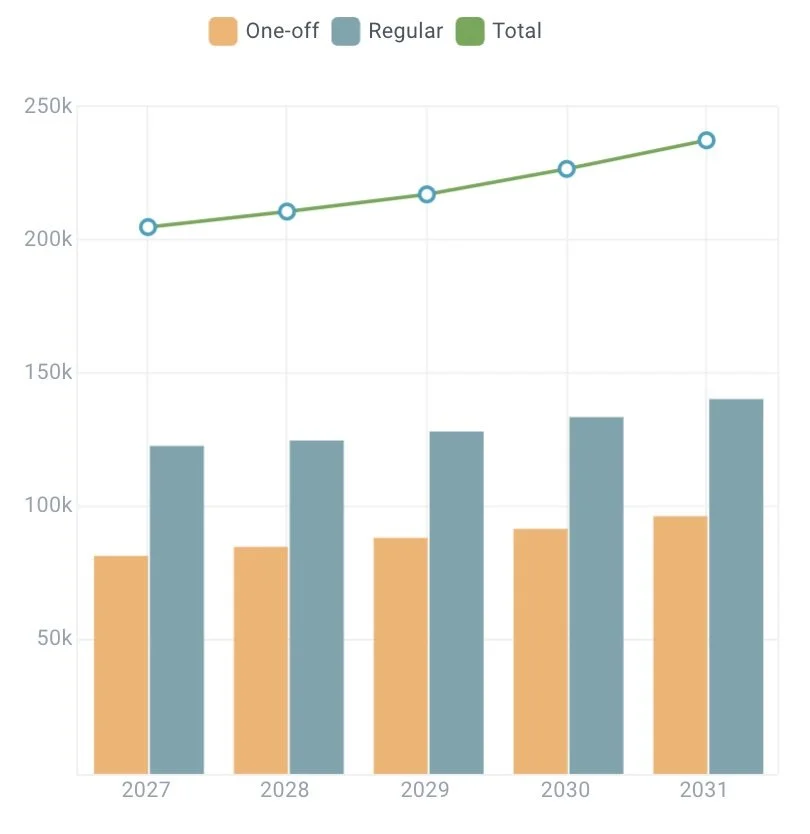
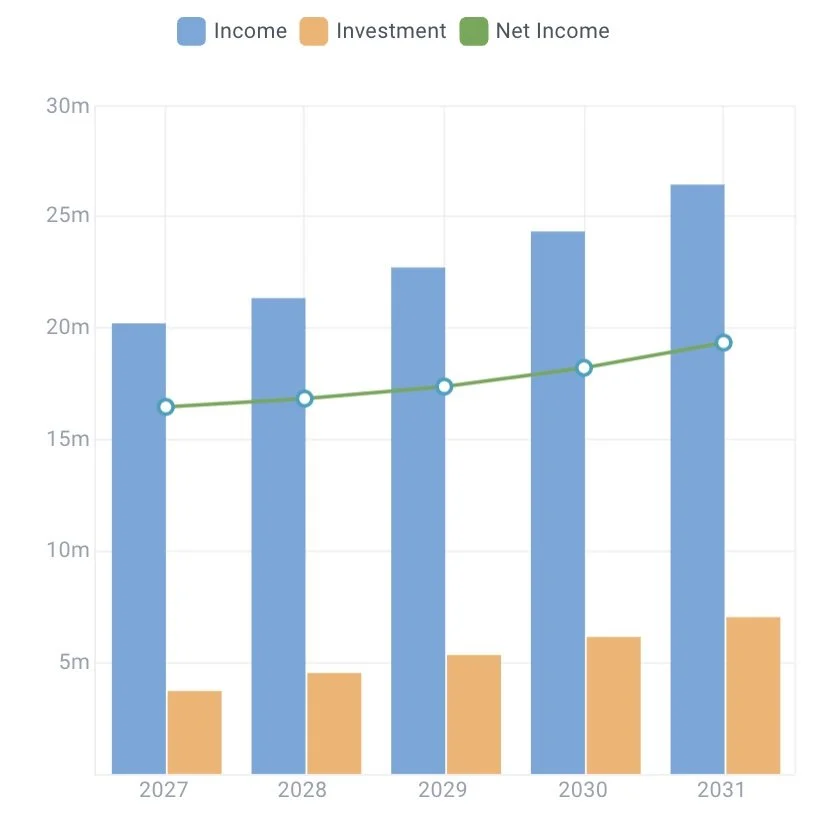
This baseline gives you a starting point for comparing future donor numbers, gross income, investment and net income.
Compare your outlook with your ambition
Define what you want your fundraising programme to achieve over five years. Your ambition might include higher income, a stronger donor base, a more diverse portfolio or more net income available for your mission.
Compare that ambition with your current outlook. Where is the gap, how large is it and when does it emerge?
This gives your team a concrete challenge to address through its fundraising strategy and investment choices.
Test different ways to close the gap
Create alternative scenarios by changing individual assumptions or combining several choices.
For example, explore higher acquisition volume, stronger retention, increased donor value, a different fundraising mix or additional investment. Test the timing of those changes as well as their scale.
Compare the results across the full five-year period. See how donor numbers, gross income, investment and net income develop — and which assumptions account for the differences.
Build a case for the investment you need
Growth may require investment well before the additional income arrives. Forward helps you see how much investment a scenario requires, when it is needed and what it could deliver over time.
Use that financial picture in discussions with Finance, leadership and your Board. Assess it alongside the people, skills and capacity needed to deliver the plan.
Explore Profitability →
Understand what needs to be true
A scenario depends on its assumptions. How realistic is the acquisition target? What supports the expected improvement in retention? Can donor value grow at the rate you have planned?
Review those assumptions together and test how the results change when performance is higher or lower than expected.
This helps your team identify where more evidence is needed, which assumptions have the greatest financial effect and what to monitor once the plan is underway.
Turn your chosen scenario into an annual plan
Once you have agreed your direction, use the first year of your five-year plan as the basis for your detailed annual plan.
Monitor actual performance, update your year-end forecast and use what you learn to revisit your longer-term assumptions.
Explore Monitoring →
Build the fundraising programme you want to have five years from now
Long-Term Planning gives you a clearer view of where you are going, what needs to change and what investment your ambition requires.
Forward gives you the model to explore those choices before you make them.
Explore more of Forward
“A very impressive model. I wish every Fundraising Director had one like this!”
“The educative power of Forward is fantastic. Both new fundraisers and oldtimers will love this tool.”